HomeRight AerrowInsightsSepratorMacroMashupSeparator
Liberation Day - Trump Flips Off America's Trade Allies
MacroMashup Newsletter

Liberation Day - Trump Flips Off America's Trade Allies

Can The Market Handle The Fallout?

Apr 4, 2025
Neil Winward

Author:

Neil Winward

|

Founder and CEO

of

Dakota Ridge Capital

Book a free energy consultation

here
    Liberation Day - Trump Flips Off America's Trade Allies
    Get our weekly MacroMashup newsletters.
    Thank you! Your submission has been received!
    Oops! Something went wrong while submitting the form.

    Welcome to Macro Mashup, the weekly newsletter that distills the content from key voices on macroeconomics, geopolitics, and energy in less than 7 minutes. Thank you for subscribing!

    Macro Mashup aims to bring together the greatest minds in Finance and Economics who care deeply about current U.S. and international affairs. We study the latest news and laws that affect our economy, money, and lives, so you don't have to.

    Tune in to our channels and join our newsletter, podcast, or community to stay informed so you can make smarter decisions to protect your wealth.

    What Is The Tariff Strategy?

    The markets have been waiting for Liberation Day. Now it has arrived, what does it mean?

    President Trump said the ‘reciprocal’ tariffs would be 50% of the rate charged to the U.S. The method used by the administration is:

    Image
    Credit to @orthonormalist for this

    There are two problems with this:

    • It is cumulative, so the reciprocal rate is stacked on tariffs already levied, e.g. add the reciprocal tariff of 34% to the existing 20% tariff on China, taking the total tariff to 54%
    • It is not clear how or when this tariff will roll-off

    The upside is that this is probably the worst case, so things can only get better from here, and at least we have some certainty now…

    What’s The Plan?

    Here’s an overview of what Trump is trying to accomplish with his tariff strategy:

    Source: JPMorgan Michael Cembalest 3-19-25

    The strategy intends to shift the dots toward the reciprocity line. The historical quid pro for this asymmetry has been that the U.S. should receive support from the U.N. votes.
    This has not worked out so well: most of the beneficiaries of the asymmetrical trade balance with the U.S. have voted with the U.S. less than 50% of the time.

    Source: JPMorgan Michael Cembalest 3-19-25

    The plan is to take tariffs back to pre-1950 levels - even if it means inflation.

    Source: JPMorgan Michael Cembalest 3-19-25

    But, the plan is not working…yet:

    • Inflation is not under control
    Source: JPMorgan Michael Cembalest 3-19-25
    • And new business orders and small business capex plans are trending in the wrong direction:
    Source: JPMorgan Michael Cembalest 3-19-25

    Our post-WWII, post-Bretton Woods deal with the rest of the world is that we buy everyone’s ‘stuff’—which drives the trade deficits—and we ‘export’ premium-priced financial assets such as stocks and bonds.

    If this deal is going to change—and President Trump wants it to change—then there will be outflows from stocks and bonds. This is one reason the financial markets are freaking out.

    According to Treasury Secretary Scott Bessent, the administration is attempting to significantly reset the economy, but for Main Street, not Wall Street, which is designed to set the U.S. on a much stronger footing.

    A group of people sitting at a tableAI-generated content may be incorrect.

    In the short term, however, the impact on the investment landscape is volatile.

    Here are a few screenshots before during and after the tariff announcements:

    Before the announcement

    SQQQ, the 3x leveraged bet on the NASDAQ going down was down on the day.

    After the announcement

    SQQQ turned around in the aftermarket yesterday and is now up nearly 14% Thursday afternoon.

    I’m Not Smart Enough to Trade This Market - Your Mileage May Differ

    Navigating this chaotic market is very hard. The long-term policy post-reset may be a good one, but getting there is like threading the eye of a tiny needle. You have to have great eyes or great trading tools.

    The chart above is crazy.

    • It shows the NASDAQ 100 index and the 3x leveraged inverse ETF SQQQ, which bets on the NDX going down.
    • The bar at the bottom indicates Relative Strength Index (RSI) divergence. RSI is an indicator of momentum based on price changes in the last 14 days.
    • The RSI divergence measures divergence from that momentum. Divergence indicates possible reversals of momentum.
    • Look at the number of bull and bear divergences in the last five days!

    Pro Tip: Stay on the sidelines when the market is like this to avoid getting hurt. Bets in either direction could be terribly wrong…or terribly right.

    Tools You Can Use If You’re Not a Day Trader

    There are two pattern indicators I like over longer cycles:.

    • Kondratieff Wave
    • Elliot Wave

    Here is a quick compare and contrast:

    • Kondratieff is a tool for understanding which market season we are in.
    • Elliot is a way to understand how prices behave within that season.
    • he chart above shows the gold price over the last five years with Elliot waves plotted.
    • A quick summary is that a typical wave cycle involves five impulse waves up or down. You can see those waves on the left in 2020 and right since 2024.
    • There don’t seem to have been many seasons for gold over the last five years: what climate alarmists would describe as a strong secular warming trend!
    • The fifth wave signals the end of a cycle, where gold seems to be at the moment.
    • The chart for Bitcoin over a similar period shows many more seasons and waves. The fifth wave occurred at $108,000, followed by a strong movement down, after which it has been range-bound between $80,000 and $90,000.3

    Pro Tip: Now might be a good time to realize some gains in gold in anticipation of a possible downward wave—a sell signal, but not all of your position.

    Bitcoin is a definite hold at this point. You were wise to sell above $100,000 or even in the 90s, but now, within the $80,000-$90,000 range, no strong trend is visible.

    What Is The Genius Act?

    • It stands for Guiding and Establishing National Innovation for U.S. Stablecoins. Huh?
    • The legislation is designed to create a sound regulatory framework for stablecoins.
    • Stablecoins are a convenient way to trade in and out of Bitcoin—or any cryptocurrency—without converting funds back into fiat currency via traditional banking systems.
    • It sounds boring, but moving cash around into and out of the banking system takes time. With stablecoins, it’s more or less instantaneous.
    • Stablecoins need to be backed by undoubted collateral, usually T-bills, to make people feel secure doing this.
    • Tether is the most well-known stablecoin
    • Tether’s margins exploded since T-Bills started earning 4%+ interest. They hold T-Bills to back the stablecoins and pay no interest, so…$144 billion of market cap at 4% interest margin…

    A cynic might say that regulation is about allowing banks to enter this very lucrative business. Here’s the legislative language.

    To qualify as a permitted payment stablecoin issuers, a person would have to incorporate in the US and then be either:
    • A federal qualified nonbank payment stablecoin issuer that have been approved by the Office of the Comptroller of the Currency (OCC) pursuant to terms set forth in the Act.
    • A subsidiary of an insured depository institution that has been approved by the depository institution’s primary federal regulator (e.g., the Board of Governors of the Federal Reserve System (“Federal Reserve”) for state member banks) pursuant to terms set forth in the Act.
    • A state qualified payment stablecoin issuer that have been approved by a state payment stablecoin regulator.

    Here’s how vital Tether is…and how important stablecoins are about to become.

    Image

    Takeaway: This is how the government finds another buyer for all the T-bills it needs to issue after it tells China to take back all its surplus capital.

    In The Markets

    I snapped this image around midday Wednesday, four hours before the formal Whitehouse announcement of tariffs. It captures the mood perfectly.

    • Volatility is up over 28%
    • Major indices are sharply down by 3.5-4.5%
    • Precious metals have had a more volatile week, especially silver, down nearly 6%
    • BTC has traded relatively better than the stock indices, and credit spreads have tightened a bit

    Markets are in the process of repricing earnings to reflect the impact of tariffs. This is going to take a while.

    What’s Next/What To Follow?

    If you have so far buried your head in the sand on robots, it might be time to start paying attention, because

    A screenshot of a messageAI-generated content may be incorrect.

    This excellent piece by The Oregon Group provides a crash course with charts. It’s worth a click.

    I watch this four-minute pre-market heads-up by Lance Roberts every morning —this one was Thursday morning. It’s worth a look.

    Five Ways To Support MacroMashup

    1. If you are interested in clean energy investment advisory services, book a complimentary call here
    2. Please subscribe to our new YouTube channel - or support our audio podcast by following us on Spotify or Apple - we appreciate your support!
    3. If you'd like me to be a guest on your podcast or guest blog about clean energy or macroeconomics, send an email to contact@macromashup.com
    4. Share this newsletter on X here
    5. If you enjoy this newsletter, please email it to a friend by clicking on the button below.
    Help others learn, click to share
      Neil Winward

      Neil Winward is the founding partner of Dakota Ridge Captial, helping investors, developers, banks, non-profits, and family offices unlock massive tax savings - on average of 7%- 10% - via clean energy investments by fully leveraging U.S. government incentives such the Inflation Reduction Act.

      BOOK A CALL

      READY TO TAKE ACTION ON YOUR ENERGY PROJECT? BOOK A COMPLIMENTARY, ZERO-OBLIGATION CONSULTATION TO SEE HOW WE CAN HELP YOU.

      Book Here
      vectorvector
      The Queue: Where AI’s Grid Constraint Gets Real
      MacroMashup Newsletter
      3

      The Queue: Where AI’s Grid Constraint Gets Real

      Neil Winward

      This week’s MacroMashup deep dive examines one of the least discussed datasets in macro markets: The US interconnection queue. More than 2,300 gigawatts of power generation are currently waiting to connect to the grid.

      MacroMashup Research Summary

      Core Thesis

      Markets are obsessed with AI chips.

      But the real constraint may be electricity.

      The US interconnection queue has become the chokepoint of American electricity expansion. Roughly 2,300 gigawatts of generation capacity are currently waiting to connect to a grid that operates at about 1,200 gigawatts today.

      Why It Matters

      AI infrastructure, electrification, and energy transition all depend on grid access. Interconnection delays now stretch three to six years in several regions, creating the first major bottleneck in the next wave of electricity demand.

      Key Data

      • 2,300 GW waiting in US interconnection queues. These projects include solar, wind, battery storage, natural gas, and other generation technologies.

      • Only ~13% of projects entering the queue ultimately complete

      • Median wait times approaching five years in several regions

      • Demand pressure ratios exceeding 5× in ERCOT

      Market Signals

      The queue is becoming a leading indicator for:

      • electricity price pressure

      • utility capex cycles

      • natural gas demand

      • regional AI infrastructure migration

      AI models scale at software speed.

      Electricity infrastructure expands at infrastructure speed.

      The Signal

      This Week’s Dashboard

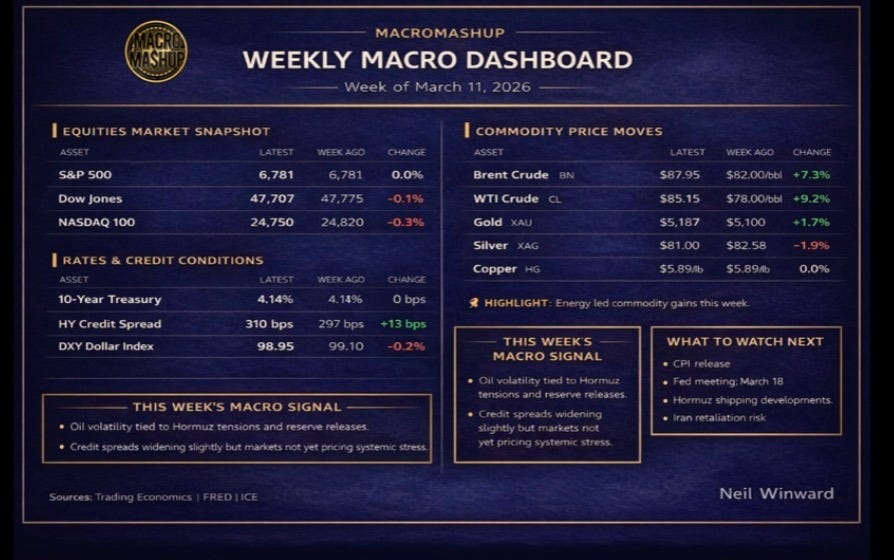
      It’s all about the barrel.

      Oil dominated nearly every signal this week. Brent crude rallied from roughly $82 to $88, while WTI followed closely, settling near $85. The Strait of Hormuz remains the transmission mechanism: tanker transits have collapsed from roughly 24 per day to single digits since the conflict began, and every headline about the Strait is now moving assets across the macro dashboard.

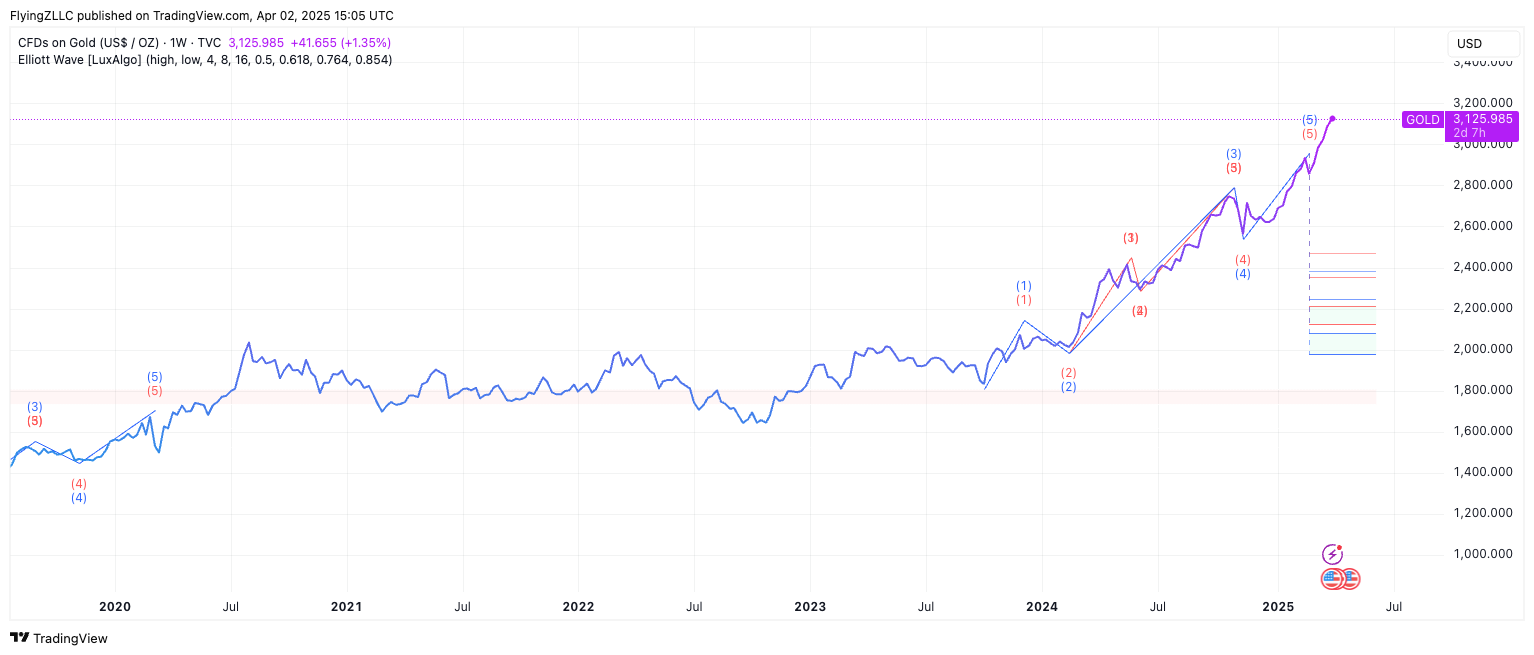
      Gold was caught in the crossfire. When oil spikes, the dollar typically strengthens on safe-haven flows and higher yields raise the opportunity cost of holding non-yielding assets. Gold sold off from its late-February highs before stabilizing this week as the dollar softened again. Central bank buying remains the structural floor, but in the short term the dollar and the 10-year yield are driving the tape.

      The information war intensified as well. President Trump posted that the conflict was “very complete, pretty much.” Netanyahu responded with a new wave of strikes on Tehran. Iran apologized to the UAE after collateral damage from retaliatory drone strikes — and then continued launching them.

      At one point the White House deleted a social media post claiming the US Navy had escorted a tanker through the Strait of Hormuz after confirming no such escort had occurred. Oil briefly dropped on the headline before rebounding.

      Meanwhile the IEA proposed the largest strategic petroleum reserve release in its history. Pipeline alternatives are suddenly receiving attention, and the market is attempting to price the difference between a four-week war and a four-month one — a distinction worth tens of dollars per barrel.

      Equities barely reacted. The S&P finished the week essentially flat at ~6,781. Credit spreads widened modestly but remain far from pricing sustained economic damage.

      Either the market is right.

      Or it hasn’t caught up yet.

      But the most important constraint shaping the next phase of this cycle may not be geopolitical.

      It may be structural.

      Because the next phase of the global economy will run on electricity.

      The Real Constraint Behind the AI Boom

      Last week we introduced the idea that AI’s real constraint may not be software.

      It may be electricity.

      This intersection between AI infrastructure and electricity systems is becoming one of the most important macro stories of the next decade.

      are launching AI Grid Report, a new research publication focused on the intersection of AI infrastructure, electricity systems, and energy markets.

      The first issues will examine how the global AI buildout could reshape electricity demand, natural gas markets, and power infrastructure investment.

      If you’re interested in how the power grid may shape the next phase of the AI economy, you can preview the project here:

      https://open.substack.com/pub/theaigridreport

      The first issues will be launching soon.

      🔒 Deep Dive for Members

      Read More
      From Hormuz to the Grid: The Chokepoints That Matter
      MacroMashup Newsletter
      3

      From Hormuz to the Grid: The Chokepoints That Matter

      Neil Winward

      Markets are modeling AI disruption at software speed. But electricity infrastructure may determine how fast the real economy can absorb it.

      Welcome to MacroMashup. We focus on constraints, not forecasts. Market structure, not vibes. Capital flows, leverage, and incentives—where things actually break.

      The week’s dominant story is geopolitical.

      U.S.–Israeli strikes on Iran. Retaliation spreading across the region. The Strait of Hormuz effectively closed. Markets scrambling to price the energy shock.

      But beneath the geopolitical noise, another question is taking shape as Anthropic and OpenAI wrestle with the Department of War over the role AI will play.

      The question is not whether AI can transform the economy and the battlefield—it already has— but how fast.

      Because AI runs on compute. And compute runs on power.

      The constraint shaping the next phase of the AI cycle may not be technological progress.

      It may be the infrastructure required to supply electricity fast enough.

      In this week’s MacroMashup deep dive, we examine:

      • why AI adoption may move at infrastructure speed rather than software speed

      • how grid constraints could shape the timeline of economic disruption

      • why energy infrastructure may become the leverage point of the AI economy

      A look at this week’s dashboard tells the story of which chokepoint is throttling harder.

      If you want to understand the structural constraints shaping global markets, join the MacroMashup community.

      Subscribe for weekly briefings examining the forces behind the next economic cycle.

      Read More
      When the Price Mechanism Breaks: What the Simon–Ehrlich Bet Gets Wrong About AI
      MacroMashup Newsletter
      3

      When the Price Mechanism Breaks: What the Simon–Ehrlich Bet Gets Wrong About AI

      Neil Winward

      Why capital misprices time-based energy constraints in the age of exponential compute.

      In 1980, Julian Simon made one of the most famous bets in economic history.

      He bet that human ingenuity would defeat scarcity.

      Paul Ehrlich bet the opposite.

      Simon won.

      Commodity prices fell.

      Technology advanced.

      Supply responded.

      The lesson became doctrine:

      When prices rise, markets fix shortages.

      That belief now underpins trillions of dollars in capital allocation.

      It also underpins the AI boom.

      But here’s the question investors are not asking:

      What happens when prices can’t fix the bottleneck?

      This week, we’re not debating AI.

      We’re not debating energy transition.

      We’re not debating scarcity narratives.

      We’re examining something deeper:

      When does the price mechanism stop working — and what does that mean for portfolio construction?

      Inside this issue:

      • Where Simon still works
      • Where the mechanism slows
      • Where it structurally fails
      • And how to allocate when constraint becomes time-based, not price-based

      Because in 2026, the edge is not identifying demand.

      It’s identifying where capital hits physical delay.

      Continue reading for the full allocator framework.

      Read More
      Sustainable energy project investment
      IRA Report To Smarter Investing
      Unlock the Opportunities of the Inflation Reduction Act!​ Are you ready to stay ahead in today's shifting economic landscape? Our comprehensive white paper breaks down the Inflation Reduction Act and reveals the key benefits, incentives, and strategies your business needs to capitalize on. Learn how to optimize your financial planning, leverage tax credits, and position your company for sustainable growth.
      Pre-order now to get the insights and actionable steps that can give your business a competitive edge.
      New Version Release Date: 12/10/2024
      Thank you! Your submission has been received!
      Oops! Something went wrong while submitting the form.
      Close icon