You’ve heard them all. You’ve rolled your eyes at some. But market clichés persist for a reason: they’re simple, sticky, and sometimes dangerously misleading. The trouble is, investors often repeat these sayings without asking if they still apply in today’s markets where AI algorithms, central bank intervention, and social media sentiment can move prices as much as fundamentals.
In classic Fearless Investor fashion, let’s slice through the noise and separate the timeless wisdom from the outdated myths.
1. Wall of Worry? Try a Wall of Shrugs.
The old line goes: “Bull markets climb a wall of worry.”
It’s still mostly true. Market tops are rarely formed in euphoria; they usually emerge when the smart money’s cautious and everyone else is rationalizing risk.
But in 2025, with central banks smoothing out volatility, “worry” isn’t what it used to be. The climb looks more like a dance along the edge of a volcano—moving forward while doomsday headlines pile up. The market knows the government is hooked on the tax receipts that flow from stock market gains. The Fed knows too.
Here’s the edge: learn to tell when the worry reflects real risk versus when it’s just headline noise.
If you’re not using options, remember you face two types of risk:
Downside risk — losing money on positions you hold.
Upside risk — selling too early and watching the asset rally without you.
Most investors only manage the first risk and miss the “melt-up.” If you’re selling based on a scary headline instead of your pre-set signals, you’re not investing—you’re reacting.
2. Trade the Market You Have, Not the Fantasy You Want
This one’s for every bear who missed the rally: “Trade the market you have, not the one you wish you had.”
It’s not surrender, it’s discipline. Markets evolve daily, and your playbook must adapt.
History’s graveyard is full of brilliant analysts who were “right too early” (Wall Street code for wrong). The pros tune out their own bias and focus on what the data says now, not on the macro story they wish would unfold. The chorus of bear commentary is drowning out the right tail risk.
3. Cut Your Losses: The Only Hill Worth Dying On
No one ever lost sleep over taking a small, controlled loss. But letting an ego trade metastasize into portfolio cancer? That will keep you up at night.
“Cut your losses” is more than a tactic, it’s a mindset.
Hope is not a strategy. If the signals you trusted to enter a trade no longer hold, exit. If the only thing that’s changed is the price, and the signals persist, why would you sell?
Know why you buy, when you should hold and when you should sell.
exit. If the only thing that’s changed is the price, your signals were flawed to begin with.
Self-discipline, not conviction, is the real alpha.
4. Buy the Dip—But Don’t Drown
In a liquidity-driven market, “buy the dip” isn’t dead, it’s just harder. AI-driven order flow has compressed pullbacks. What used to be a 5% drawdown now rebounds 2% before you’ve even clicked “buy.”
Today, buying the dip means adding exposure in liquid conditions and stepping aside when the water turns choppy. Valuations are stretched, but there are two ways to fix that: price falls, or earnings catch up. We just had a very strong earnings season.
If you’re under-allocated to a position you believe in, dips can be your friend. If you’re fully invested, chasing small rebounds can turn you into the liquidity for someone else’s exit.
5. Sell in May? Only If You Vacation with Dinosaurs
Back when trading floors thinned out over summer, “Sell in May and go away” had teeth. Now, ETFs, retail flows, remote trading, and offshore liquidity have erased most seasonality patterns.
That doesn’t mean it’s worthless, just that you need to confirm in real time whether the pattern is in play or being gamed by algorithms.
The lesson? Old data is history. The signals of today decide your next move.
Cliché Survival Guide: How to Use Them Without Getting Burned
Check the context. Is the cliché explaining the past or predicting the future? Only the latter is actionable.
Beware absolutes. When the crowd’s certainty is at 100%, that’s often the point of reversal.
Backtest. Run the numbers. Most of these sayings don’t hold up to even a basic statistical check.
Every cliché started as a kernel of truth. But if you accept them blindly, you’re no longer the investor, you’re the yield.
Final Thought: In volatile markets, trust comes from process. Build a system. Follow your signals. Adapt when the data changes.
📊 Want help building your portfolio strategy based on macro fundamentals?
Neil Winward is the founding partner of Dakota Ridge Captial, helping investors, developers, banks, non-profits, and family offices unlock massive tax savings - on average of 7%- 10% - via clean energy investments by fully leveraging U.S. government incentives such the Inflation Reduction Act.
BOOK A CALL
READY TO TAKE ACTION ON YOUR ENERGY PROJECT? BOOK A COMPLIMENTARY, ZERO-OBLIGATION CONSULTATION TO SEE HOW WE CAN HELP YOU.
Conviction is not confidence — it’s risk budget allocation. An allocator-grade framework for sizing positions inside liquidity and funding constraints in 2026.
Conviction is not a strategy.
It’s a sizing decision.
In 2026, most portfolios aren’t failing because the thesis was wrong.
They’re failing because the risk budget was misallocated.
Performance is often driven by how much size you assign — not how smart the idea is.
This week, we break down:
Why “high conviction” is often just concentrated exposure to one funding regime
How risk budgets quietly inflate in calm markets
A systems-level filter for deciding what truly deserves size
This is not about picking better ideas.
It’s about allocating capital in proportion to structural durability.
2025 proved that being broadly right isn’t the same as being effectively positioned.
Welcome to Fearless Investor — calm thinking for chaotic markets.
Each week, we break down macro constraints, capital flows, and portfolio structure so serious investors can stay oriented while others react.
Subscribe so you don’t miss the next deep dive.
Concentration Wins in Constraint Regimes
(Why 2025 punished diversification and rewarded alignment)
For most of the last decade, diversification felt like discipline.
Cheap capital, low volatility, and abundant liquidity meant that spreading exposure across many ideas rarely carried a penalty. Even mediocre positioning was forgiven as long as markets continued to rise.
2025 was different.
Not because volatility exploded — but because constraints finally mattered again.
Energy wasn’t a theme.
Liquidity wasn’t evenly distributed.
AI wasn’t limited by imagination, but by power, infrastructure, and balance sheets.
In that environment, being broadly right stopped being enough.
From a capital allocator’s perspective, the defining feature of 2025 wasn’t dispersion across assets — it was dispersion across outcomes. A small number of aligned positions did the overwhelming majority of the work. Everything else ranged from marginal to distracting.
This wasn’t a failure of diversification as a principle.
It was a failure of diversification without hierarchy.
Markets don’t react to headlines — they react to constraints. And when constraints bind, capital doesn’t reward optionality evenly. It flows toward the assets, structures, and balance sheets most directly exposed to the bottleneck.
In 2025, portfolios that tried to “own a little of everything” often diluted their best ideas with exposures that had no meaningful path to upside under real-world limits. Meanwhile, portfolios that expressed conviction — carefully, deliberately, and with size — captured the asymmetry.
This matters less for narratives and more for balance sheets.
Because the real challenge isn’t identifying the right macro view.
It’s deciding how much capital that view deserves — and what gets crowded out as a result.
Why This Becomes Harder in 2026
The lesson from 2025 is not to trade more.
It’s to manage success correctly.
As gains compound, the temptation is to protect them with complexity: more positions, more hedges, more “diversification” layered on top. But in constraint-driven regimes, complexity often adds friction faster than it adds resilience.
The edge going into 2026 is still macro.
The risk is behavioral.
And that brings us to the part most investors avoid: looking honestly at what drove returns — and what didn’t.
Before looking forward, it’s worth being explicit about what 2025 actually produced at the portfolio level — not just in narrative terms, but in structure.
That’s where the real work begins.
Want to Go Deeper?
If you’re an investor exploring energy deals or private opportunities, you can book a call with Dakota Ridge Capital here:
👉 https://dakotaridgecapital.com/contact
And if you want weekly insight, deeper analysis, and access to a serious investor community, you can learn more about the Fearless Investor Community here:
👉 https://dakotaridgecapital.com/community
No hype.
No panic.
No guessing.
Just smart decisions, made consistently.
Continue reading for the member-only analysis below.
In the premium section, we go beyond theory and show how this framework is implemented.
Fearless Investor Premium Members get:
A full walk-through of how we apply the 2026 Market Constraint Checklist to portfolio construction
A side-by-side comparison of diversified vs. concentrated outcomes from 2025
Position-sizing logic used inside real portfolios
The Constraint Alignment Test: a practical tool to stress-test whether an asset deserves capital
Learn how to build an automated Investor OS for 2026 using institutional-style systems. Reduce noise, remove emotion, and manage portfolios with disciplined, repeatable processes.
Welcome to The Fearless Investor. If you’re serious about leveling up your investing in 2026, you’re in the right place. Today’s article breaks down how to build a fully automated Investor OS — the same type of system institutions use, but simplified for real humans. Hit Subscribe so you never miss a macro or portfolio systems deep dive.
Most investors don’t need more information.
They need a system — one that filters the noise, automates the essentials, and keeps your portfolio aligned with your long-term thesis.
In 2026, the edge won’t come from better predictions.
It will come from better process.
Let’s build your Investor OS.
Automate the Boring, So You Can Optimize the Important
Retail investors manually track news, watch tickers, and react to volatility.
Professionals automate the entire foundation:
✓ Income → Investment Pipeline
Automatic transfers into investment accounts the moment income lands.
A practical framework for protecting capital while still capturing upside
Welcome to The Fearless Investor. If you’re serious about leveling up your investing in 2026, you’re in the right place. Today’s article breaks down how to build a fully automated Investor OS — the same type of system institutions use, but simplified for real humans. Hit Subscribe so you never miss a macro or portfolio systems deep dive.
Volatile Markets and the Illusion of Safety
Volatile markets make investors uncomfortable for one reason: uncertainty. Prices swing, news cycles panic, forecasts contradict each other, and an asset can look both overvalued and undervalued on the same day.
Most investors react in one of two ways:
retreat into cash
chase whatever’s been going up
Both responses feel logical.
Both responses usually lose.
The barbell portfolio takes a different approach. Instead of trying to predict the middle — what the market should do — it builds strength at the extremes: safety on one end, growth on the other, nothing fragile in the middle.
Nassim Taleb popularized the concept in risk theory. Investors adapted it to personal portfolios. Today, it’s one of the most practical ways to stay solvent and stay exposed during uncertainty.
This guide walks through the entire approach in plain English.
Why Traditional Portfolios Break in Volatile Markets
Conventional portfolios cluster in the vulnerable middle:
bonds that lose when rates rise
stocks that lose when growth slows
“diversified” funds that correlate at the worst time
In calm markets, the middle feels safe.
In stormy markets, the middle absorbs all the damage.
Volatility creates three predictable problems:
pricing becomes irrational
correlations spike
fear overwhelms logic
A barbell portfolio doesn’t try to guess outcomes — it survives both directions.
What a Barbell Portfolio Actually Is
Visualize a barbell:
SAFE SIDE — nothing in the middle — GROWTH SIDE
The structure:
One side holds the safest, most liquid assets.
The other side holds your highest asymmetric upside.
Very little sits in the fragile middle.
The weight of the safe looks disproportionate
The upside of the growth positions balances
It’s not speculation.
It’s not cash-only defensiveness.
It’s controlled exposure with built-in resilience.
The Safe Side
Examples:
Treasury bills (3–12 months)
Short-duration investment-grade bonds
Government money markets
FDIC-insured high-yield savings
Purpose:
preserve capital
reduce volatility
create liquidity for opportunity
Safe assets aren’t meant to impress — they’re meant to keep you standing.
The Growth Side
This is where upside lives:
equities
innovation sectors
private market deals
venture-style exposures
digital assets (when appropriate)
It doesn’t need to win often — it just needs a handful of big winners that outweigh smaller losses.
The growth side captures asymmetry.
The safe side absorbs shocks.
The middle is avoided because it offers neither.
Why This Structure Works
It prevents panic selling
Safety reduces emotional pressure.
It keeps you exposed to upside
Retreating to cash means missing recoveries.
It benefits from volatility
Safe assets become fuel for future opportunity.
It matches human psychology
A portfolio you can tolerate is a portfolio you won’t sabotage.
How Much Goes on Each Side?
There’s no formula — only principles:
Safe side: big enough that you never panic.
Growth side: small enough that losses don’t break you.
Examples:
Conservative: 80% safe / 20% growth
Balanced: 70% safe / 30% growth
Aggressive: 60% safe / 40% growth— don’t confuse this with traditional 60/40 stocks and bonds
Safety buys confidence.
Confidence prevents mistakes.
Avoiding mistakes outperforms complexity.
Building the Safe Side
Examples:
6-month T-Bills
Treasury money market funds
High-yield savings
Short-duration IG bonds
Reason:
Duration creates volatility.
Short-duration assets do not implode when rates move.
Long bonds can.
Safe assets also make volatility useful — they give you the ability to buy when others can’t.
Building the Growth Side
Growth exposures include:
broad equities
sector leaders
innovation ETFs
early-stage or private deals
real estate
digital assets
The objective isn’t perfection.
It’s exposure to asymmetric payoff profiles.
The assets avoided:
low-growth dividend funds
long-duration bonds
expensive balanced mutual funds
slow-moving products that still lose during stress
If it won’t protect you in the downside and won’t deliver big upside, it doesn’t belong in a barbell.
Deep Dive #27
This is where the practical, deep-dive guidance begins.
In this week’s premium Fearless Investor deep dive, we break down:
Three barbell allocation models for different risk levels
How to size your safe side vs. your growth side
How to incorporate alternatives, energy plays, and private deals
A behavioral checklist that prevents emotional investing
Advanced rebalancing rules used by institutions
A full example portfolio you can copy or adapt
A “stress test” diagnostic for your current portfolio
If you want the full, step-by-step process to make your portfolio volatility-proof in 2026, upgrade to ReadOn and unlock the rest of this guide.
👉 Subscribe to Fearless Investor to continue reading and access all premium strategy reports.
A practical routine to stay in control of your money, without spreadsheets or stress
Most investors spend more time picking individual stocks than checking whether their portfolio still makes sense. Months go by, markets move, and suddenly a “diversified” portfolio looks nothing like it did when you built it. A tech rally might inflate one position to 20% of your net worth. A few bad months in bonds might drag you into a risk profile you never planned. Fees that once looked small start to compound against you.
A calm, systematic portfolio audit prevents this drift. You don’t need a financial advisor, a complicated model, or a weekend locked away with spreadsheets. You only need half an hour and a repeatable framework.
This guide walks you through a 30-minute routine designed for real investors—people balancing work, family, and life, who want to grow wealth without micromanaging every market twitch. Use it monthly, quarterly, or after major life changes. The more consistently you run it, the more disciplined—and profitable—your investing becomes.
Why disciplined investors don’t “pick sides” — they build portfolios that survive every market cycle.
Investors love to talk about what they’re “into.”
“I’m not into precious metals.” “I don’t believe in bonds.” “I’m not a tech person.” “Gold is just for preppers.”
Statements like these get thrown around casually—cocktail-party finance disguised as conviction. But beneath the surface, they reveal a costly misconception: that building wealth is about liking or disliking certain investments, rather than strategically assembling assets that serve evolving goals.
This mindset isn’t harmless. It leads people to avoid diversification, misread risk, and dismiss powerful tools simply because they don’t fit their personal narrative.
In the Fearless Investor newsletter, our guiding principle is simple:
True investors aren’t loyal to asset classes. They are loyal to outcomes.
They aren’t “into” or “not into” gold, equities, real estate, bonds, or alternatives. They are into frameworks, time horizons, and disciplined allocation.
Personal preference is irrelevant. Performance and purpose are what matter.
Let’s break down why ditching emotional allegiance to certain assets is essential for every serious wealth builder.
Returns aren’t the full story. Risk is your shadow. Whether you’re swinging for the fences in AI stocks, edge hunting in hydrogen credits, or protecting capital in slow-and-steady muni bonds, smart investing means understanding risk-adjusted return. This issue unpacks the heavyweight trio: Sharpe. Sortino. Calmar. Each brings a slightly different lens for evaluating rewards relative to the risks you actually take.
Why Risk-Adjusted Returns Beat Raw Returns (Every Time)
Imagine two strategies:
Both return 10% a year.
The first felt like a smooth ride—a few dips, mostly up.
The second? Wild swings, at times down 30%, white-knuckle volatility.
Which one would you pick? Risk-adjusted return ratios aren’t just for quants or fund managers—they clarify which return is worth the rollercoaster. Call it “sleep-at-night-alpha”.
1. The Sharpe Ratio: Your Fundamental Fitness Test
What is it?
The Sharpe Ratio measures how much excess return you’re earning per unit of total risk. It’s like calculating “miles per gallon” for your portfolio, adjusting for all the bumps and boosts.
Formula:
Sharpe Ratio = $ \frac{R_p - R_f}{\sigma_p} $
Portfolio Return (RpR_pRp): The average return over a period.
Standard Deviation (σp\sigma_pσp): The wiggle in your returns, both upswings and downswings.
Plain English:
Higher Sharpe = you’re rewarded more per unit of risk.
Negative Sharpe? You’d have been better off in bills.
Above 1: Good. Above 2: Elite. Above 3: Unicorn territory.
How to use it:
Compare funds or strategies with different volatilities.
Spot “luck” vs “skill”—a wild ride with high returns but also high standard deviation might have a mediocre Sharpe.
Recognize when “chasing” high returns isn’t worth the suffering.
Common Pitfalls:
Treats all volatility as bad, even upside wobbles.
Looks backward: past performance, not future prediction.
Sharpe Ratio in Action:
Suppose your ETF returns 15%, the 10-year Treasury pays 4%, and your standard deviation is 10%. Sharpe = (15−4)/10= 11/10.10=1.1
Translation: This portfolio is earning 1.1% of excess return for every 1% of risk.
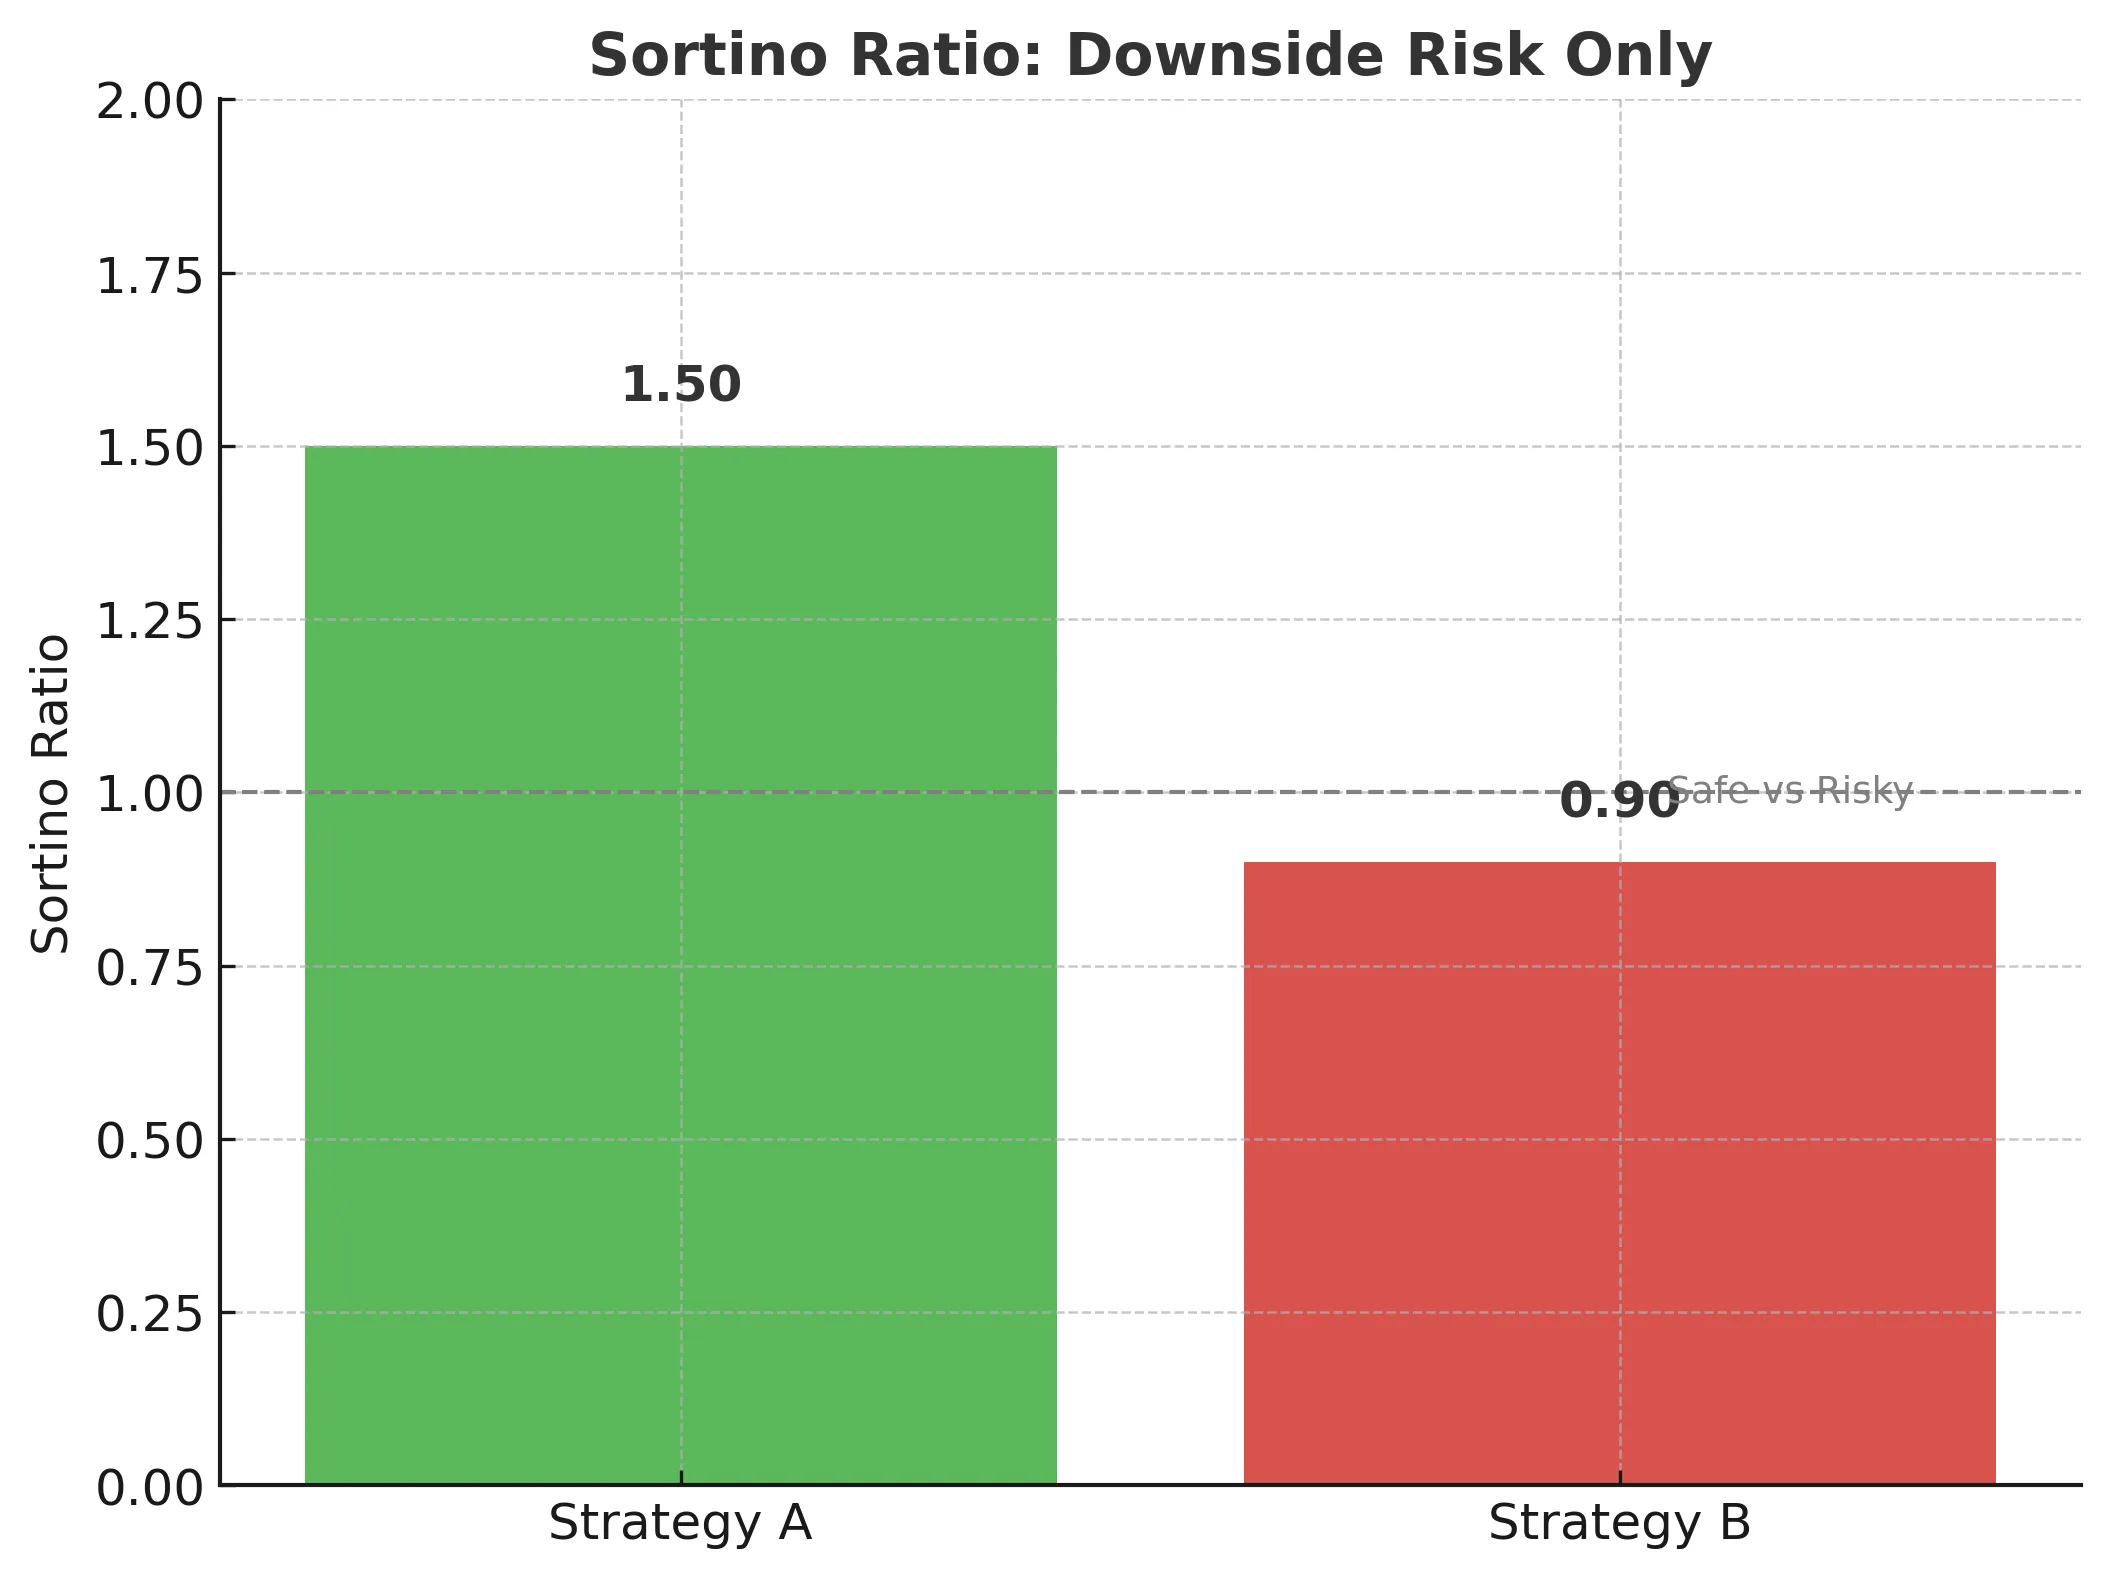
2. The Sortino Ratio: All Downside, No Excuses
What makes the Sortino Ratio different?
Sharpe penalizes all volatility. But most investors only care about downside—when their money shrinks, not when it outperforms. Enter Sortino: the refined risk-adjusted lens that zooms in solely on negative surprises.
Formula:
Sortino Ratio = $ \frac{R - MAR}{\sigma_d} $
Return (RRR): Actual or expected return.
Risk-free rate (Rf): The return you “require” (often a risk-free or hurdle rate).
Downside Deviation (σd\sigma_dσd): Only the bad volatility—how far negative returns fall below MAR.
In Practice:
Helps you spot investments that only blow up on the downside.
Preferable when comparing two strategies with similar returns, but radically different left-tail (loss) risks.
Investment B: Also 14% return, but high downside deviation (10%). Sortino = (14−5)/10=0.9
Fearless takeaway: B’s return is less “safe,” so its Sortino is lower, despite similar average performance.
Why does this matter?
If you want to avoid catastrophic losses, Sortino will show you which portfolios hide sharks below the surface.
Used heavily by asset allocators, hedge funds, quant shops.
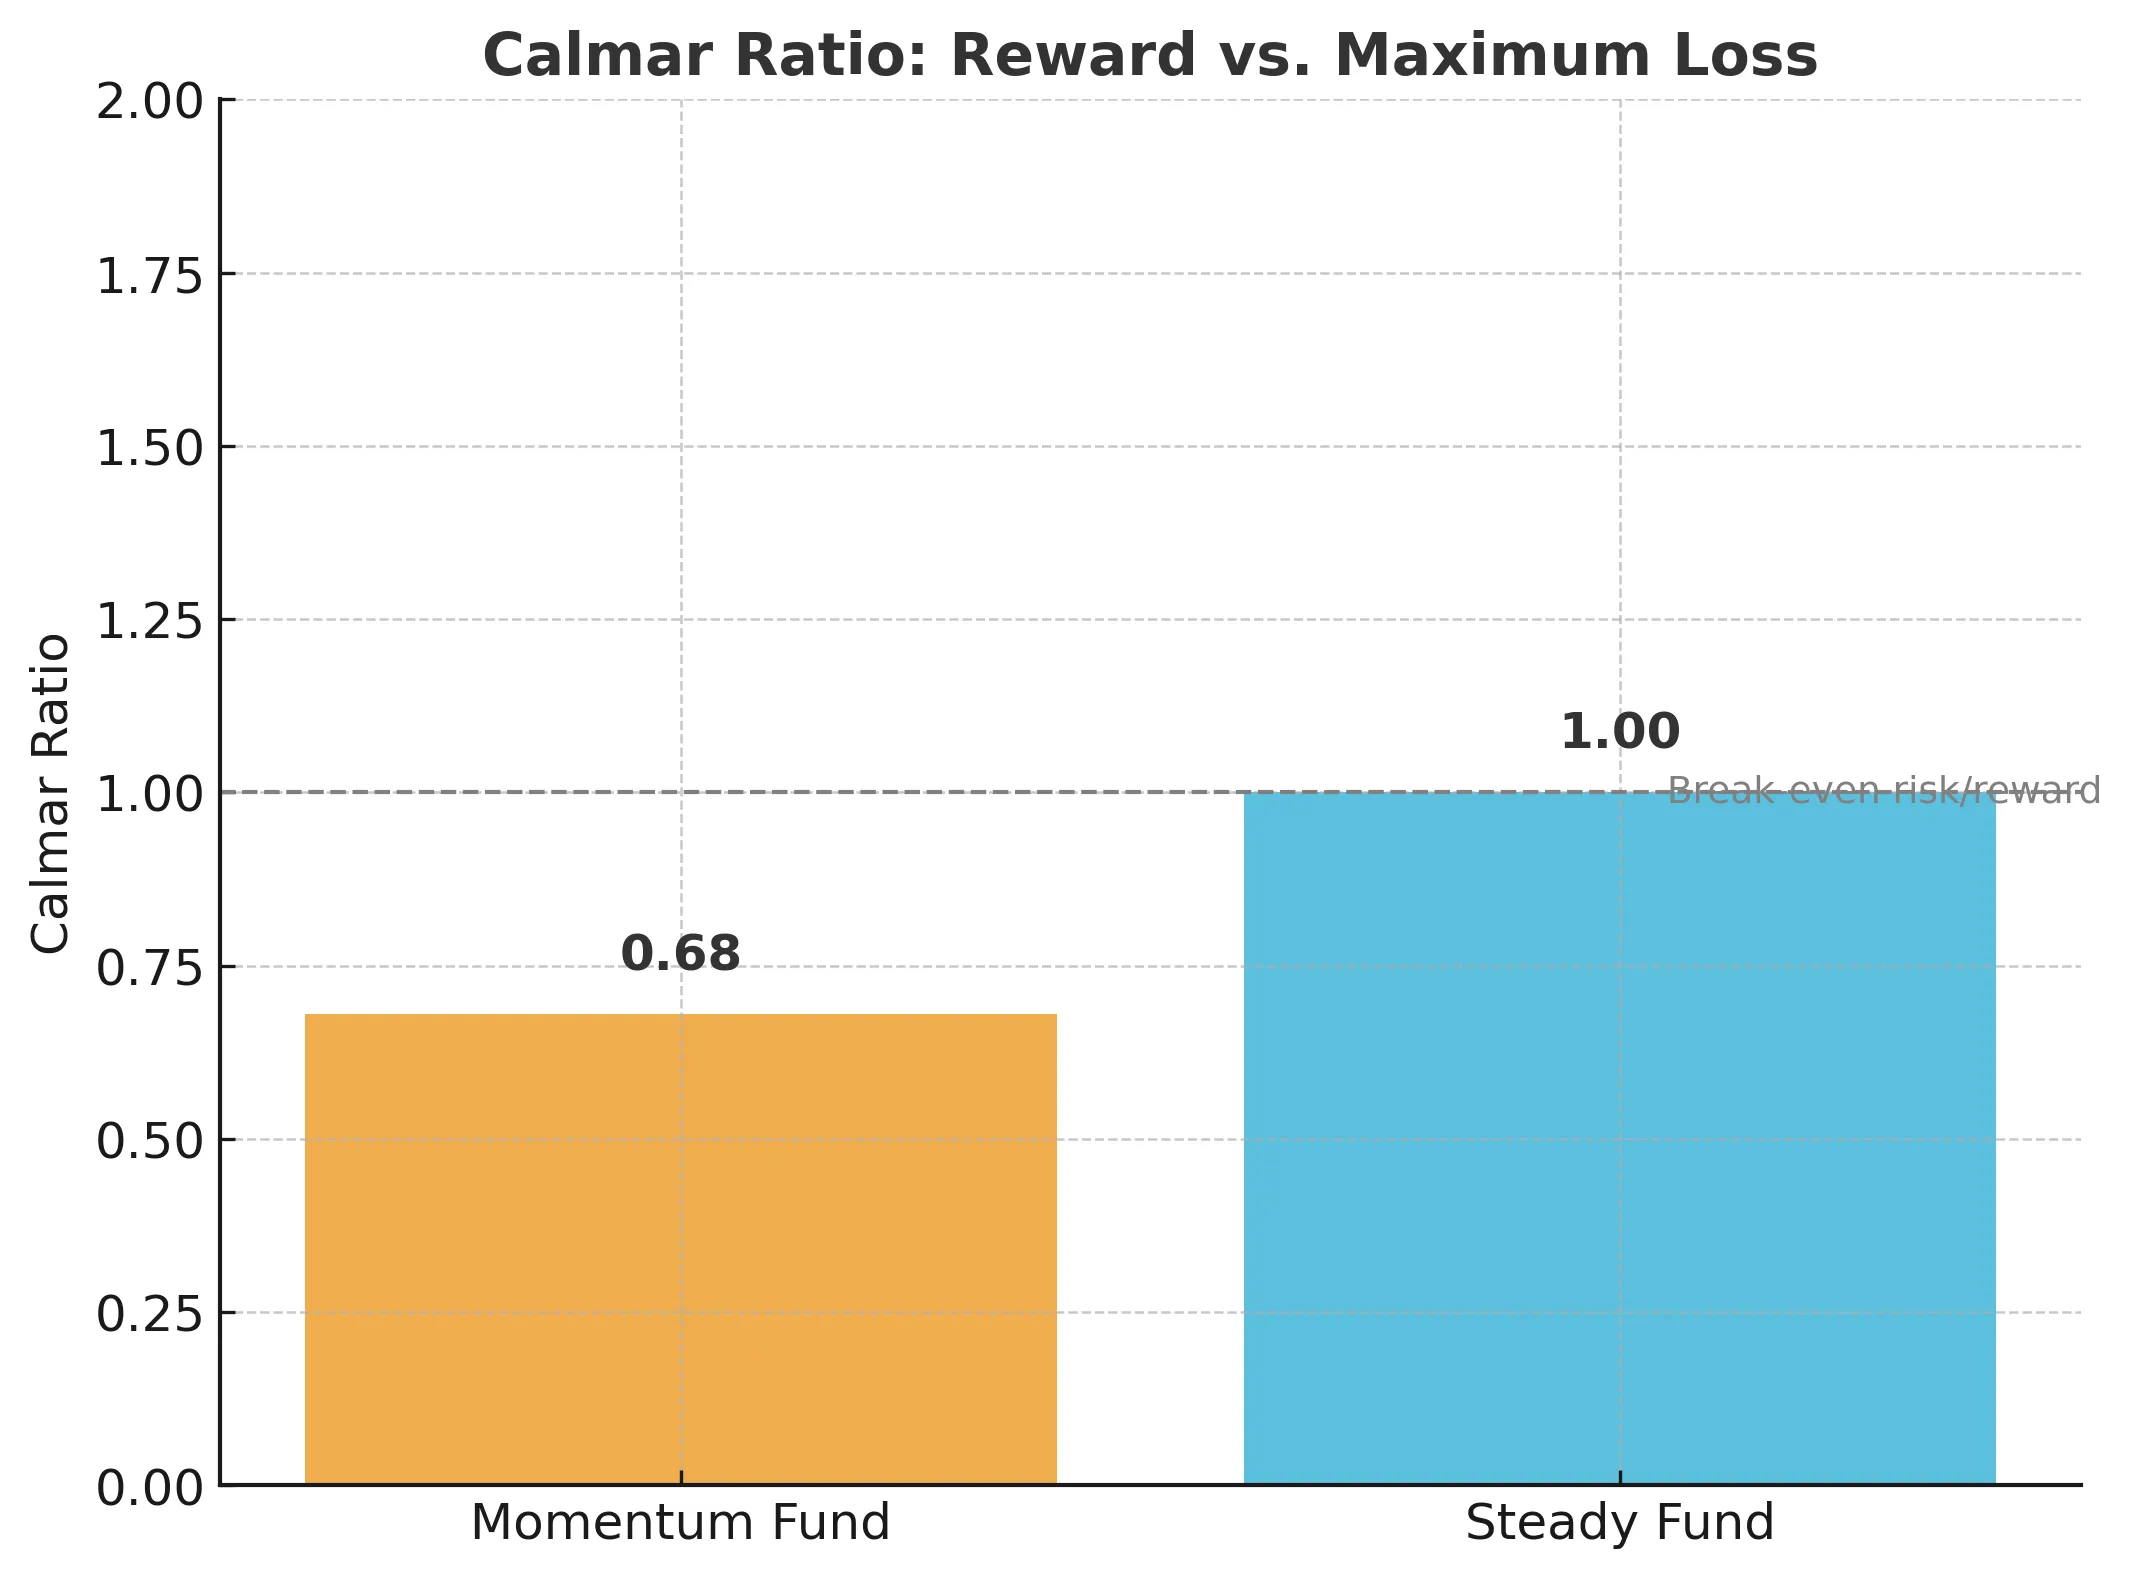
3. The Calmar Ratio: Stress-Testing the Drop
What is the Calmar Ratio and why should you care?
The Calmar Ratio directly addresses your greatest fear: max drawdown. It answers the question—how big a crash did you endure for the returns you got?
Formula:
Calmar Ratio = $ \frac{R_{\text{ann}} - R_f}{\text{Max Drawdown}} $
Annualized Return: The compound annual growth rate (CAGR) over the period (often 3 years for funds).
Risk-free rate (Rf): The return you “require” (often a risk-free or hurdle rate).
Maximum Drawdown: The single worst peak-to-trough hit your portfolio experienced.
How to use Calmar Ratio:
Ideal for comparing funds, CTAs, and hedge strategies that suffer occasional (potentially severe) losses.
Favored by alternative asset managers and risk-averse allocators.
Sample Calculation: Say a momentum hedge fund posts 21% annualized return, the risk-free rate is 4%, and—in a rough patch—it dropped 25% from peak to trough. Calmar = (21−4)/25=0.68
Translation: For every 1 unit of major loss suffered, you earned 0.68 units of return.
Now, consider a macro hedge fund that posts a 29% annualized return, the risk-free rate remains 4%, and at some point experienced a 25% max drawdown.
Calmar = 29-4/25 = 1.0
Translation: For every 1 unit of major loss suffered, this fund delivered 1 unit of return.
Calmar’s Advantage:
Shines a spotlight on funds that strut for years, then drop 40% and wipe out multi-year gains.
Useful in environments where “tail risk” (black swan events) is the real risk.
Limitations:
If you’re analyzing a period without a big storm, Calmar might look too rosy.
Doesn’t account for frequent small losses, just the biggest loss.
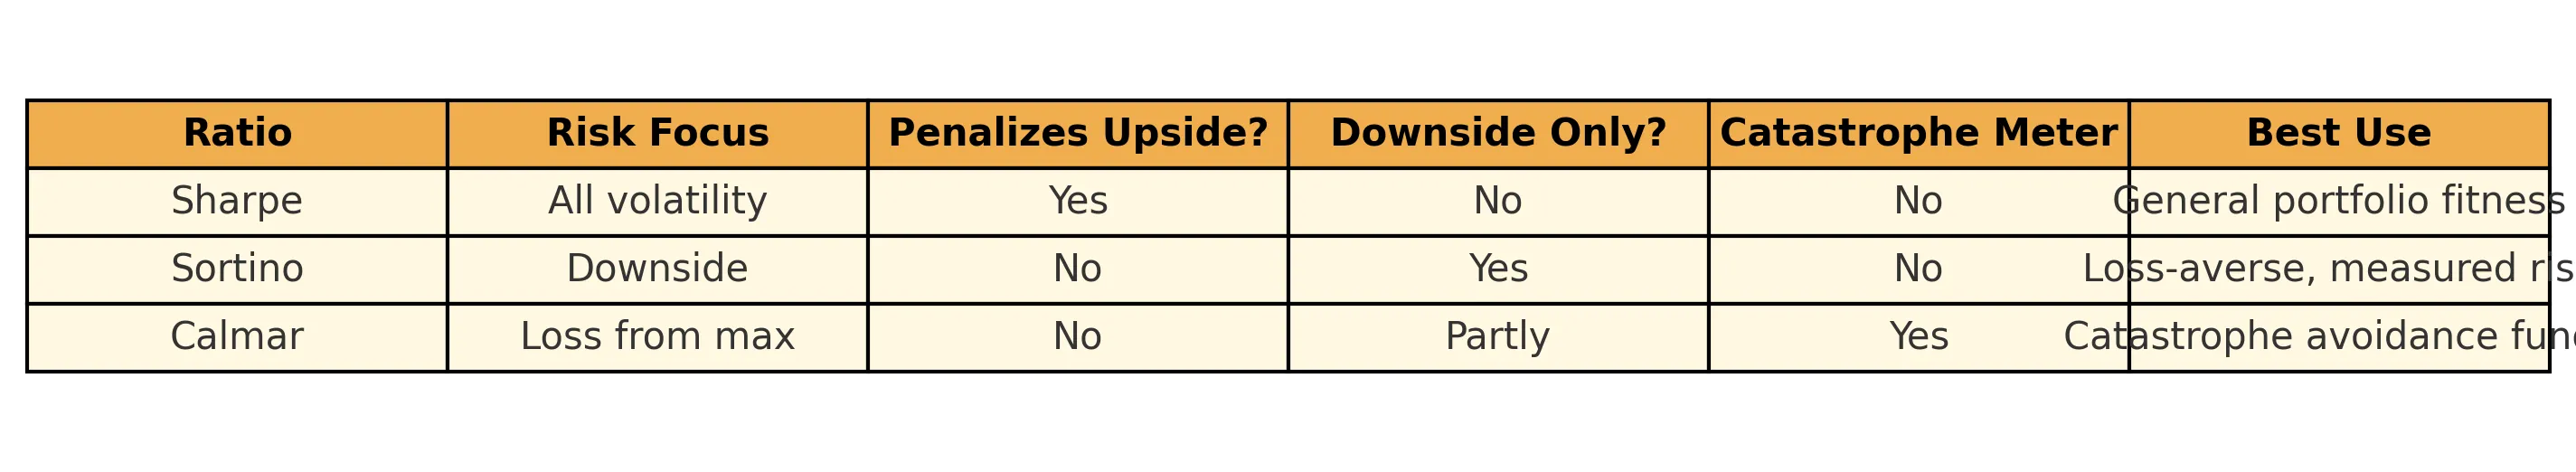
Tying the Ratios Together: Which One Should You Use?
Pro Move: Always compare apples to apples—don’t use Calmar for day-trading and Sortino for long-only blue chips. Use all three for a complete risk fingerprint of any strategy.
Fearless Action Steps
1. Get Your Numbers. Start with a simple spreadsheet or portfolio platform. Plug in your returns, benchmark, and standard deviation (or use built-in tools for these ratios).
2. Sharpe > 1 is table stakes, > 2 is pro. If you’re stuck under 1, reassess your strategy or move more to low-risk assets.
3. Sortino for Sensitive Stomachs. For strategies sensitive to big drops (think: options, levered ETFs, small caps), Sortino will warn you early.
4. Use Calmar to Avoid Blow-Ups. Look at drawdowns over full market cycles, not just bull runs. Bleeding a little is okay—hemorrhaging isn’t.
5. Pick the Right Ratio for Your Personality. Are you okay with swings so long as you win? Sharpe and Sortino will suffice. Do you “hate losing more than love winning”? Add Calmar to the mix.
Final Word: Build, Don’t Gamble—Measure Your Risk Like a Pro
Fortunes are won by those who take smart, measured risks—and keep what they’ve built. Use Sharpe to size up overall efficiency. Use Sortino to avoid hidden sucker punches to the downside. Use Calmar to ensure you never lose your shirt in a once-in-a-decade storm. The truly fearless investor is never reckless—just relentlessly, mathematically prepared.
See more actionable risk and reward breakdowns in next week’s edition. And remember: in markets, as in life, the brave aren’t those who never worry—they’re those who count the cost, then charge ahead anyway.
Next Steps
📊 Want help building your portfolio strategy based on macro fundamentals?
Harness the wisdom of markets with passive investing, and find real alpha through smart asset allocation
If there’s one lesson markets keep teaching, it’s this: outsmarting them is far harder than it looks—because the market is already the sum of everyone’s smarts, mistakes, and biases.
The “wisdom of crowds” isn’t just a behavioral finance cliché—it’s why most stock pickers, even the pros, lag index funds over time. But what if the real edge for active investors isn’t in picking stocks at all?
The Jelly Bean Jar and the Iron Law of Index Funds
Picture a county fair. A giant jar is filled with jelly beans. Everyone guesses the total—some way high, some way low. Almost nobody nails it, but the average of all guesses comes surprisingly close to the real number.
That’s the market. Millions of investors—quants, institutions, retirees, meme traders—constantly update their “guesses” about the future value of assets. Prices reflect the crowd’s collective judgment.
Can you beat that average? Occasionally, yes. But decades of data say the odds are against you, which is why even elite managers often lag their benchmarks. Legendary investor Ben Graham reached the same conclusion: once markets became broad, fast, and well-analyzed, the low-hanging fruit was gone.
Where Indices Shine—And Where They Don’t
Indices like the S&P 500 or MSCI World are more than baskets of stocks—they’re massive, self-rebalancing crowdsourcing engines.
Why passive works so well in efficient markets:
Harnesses the collective intelligence of millions
Eliminates high fees and trading costs
Protects against emotional decision-making
This works best in “crowded” markets—U.S. large-cap equities, major developed nations—where information is fast and participation is huge.
When the Crowd Gets Thin—Why Asset Allocation Is Different
Asset allocation—how you divide capital between stocks, bonds, cash, commodities, gold, crypto—isn’t set by a single market mechanism.
Investors have different needs, risks, and tax regimes
Asset popularity changes with inflation, policy shifts, and tech revolutions
Correlations change with the macro weather
The average 60/40 portfolio is a fine starting point, but it’s not universally optimal. Allocation markets are less “efficient,” leaving more room for skilled active decision-making.
Why Active Rotation and Allocation May Be the Last Honest Alpha
Macro signals matter: Rotating between stocks and bonds with the cycle can save or make fortunes
Crowd averages aren’t tailored: Your life circumstances aren’t “average”
Neglected corners exist: In thin markets (like commodities in 2020), the crowd’s wisdom is less reliable
Risk evolves: The crowd often fights the last war; active allocation adapts to new realities like crypto or private credit
The Smart Blend—Passive for the Core, Active for the Map
Fearless Investor approach:
Build your core with indices for efficient markets—let the crowd work for you
Apply judgment to allocation—adjust your “map” based on macro, risk data, and scenarios
Rebalance, don’t chase—use drift as a signal, not a panic button
Question consensus in thin markets—these are the places for active plays
Customize for your reality—your best allocation is personal and adaptive
Bottom line: Don’t try to beat the crowd at their strongest game—stock picking in efficient markets. Instead, harness their wisdom for your core, and use active, thoughtful allocation where the crowd is weakest.
Lean in. Fear less. Let the crowd set your price—while you set your path.
Outsmart the Market: The Power of Rotation & Allocation
Most investors obsess over stock picks.
But the pros?
They obsess over allocation and rotation.
If those words sound like CNBC jargon, don’t worry. This article will break them down, explain why they matter more than individual trades, and walk you through how to apply them to your own portfolio using a macro-aware, behaviorally smart approach.
Rotation and Allocation—What Do They Mean?
Let’s start simple:
Rotation = where capital is moving (in and out of sectors or asset classes).
Allocation = how your portfolio is divided up across those sectors or asset classes.
So why does this matter?
Because chasing hot stocks without understanding why they’re hot—or when they’ll cool off—is gambling, not investing.
Understanding rotation helps you:
Spot early macro trends before they go mainstream.
Anticipate which sectors are likely to outperform (or underperform) next.
Avoid holding yesterday’s winners while everyone else is moving on.
Understanding allocation helps you:
Manage risk through diversification.
Maximize returns by tilting toward favorable macro conditions.
Stay grounded with a system—rather than reacting emotionally to headlines.
What’s “The Great Rotation” Everyone Talks About?
In financial media, you’ll often hear about “The Great Rotation”—usually in reference to investors shifting out of one major asset class into another.
Examples:
From growth to value stocks
From U.S. equities to emerging markets
From bonds to commodities
From tech to energy
From risk-on to risk-off
These shifts don’t happen at random. They follow macro cycles—driven by interest rates, inflation expectations, global demand, fiscal/monetary policy, and investor sentiment.
If you want to stay ahead of the market, you need to track the why behind the rotation—not just the headlines about what is rotating.
Allocation: The Holy Grail of Diversification
Diversification isn’t just a checkbox. It’s your portfolio’s airbag when markets crash—and its engine when the right sectors take off.
But diversification doesn’t mean buying everything and hoping something goes up.
It means allocating intentionally based on macro trends, risk tolerance, and personal goals.
Ask yourself:
What stage of the economic cycle are we in?
Which asset classes tend to do well in that stage?
How much downside am I willing to tolerate in pursuit of upside?
What Assets Deserve a Place in Your Portfolio?
Your portfolio isn’t a popularity contest—it’s a war room.
Here’s how I think about asset classes in 2025:
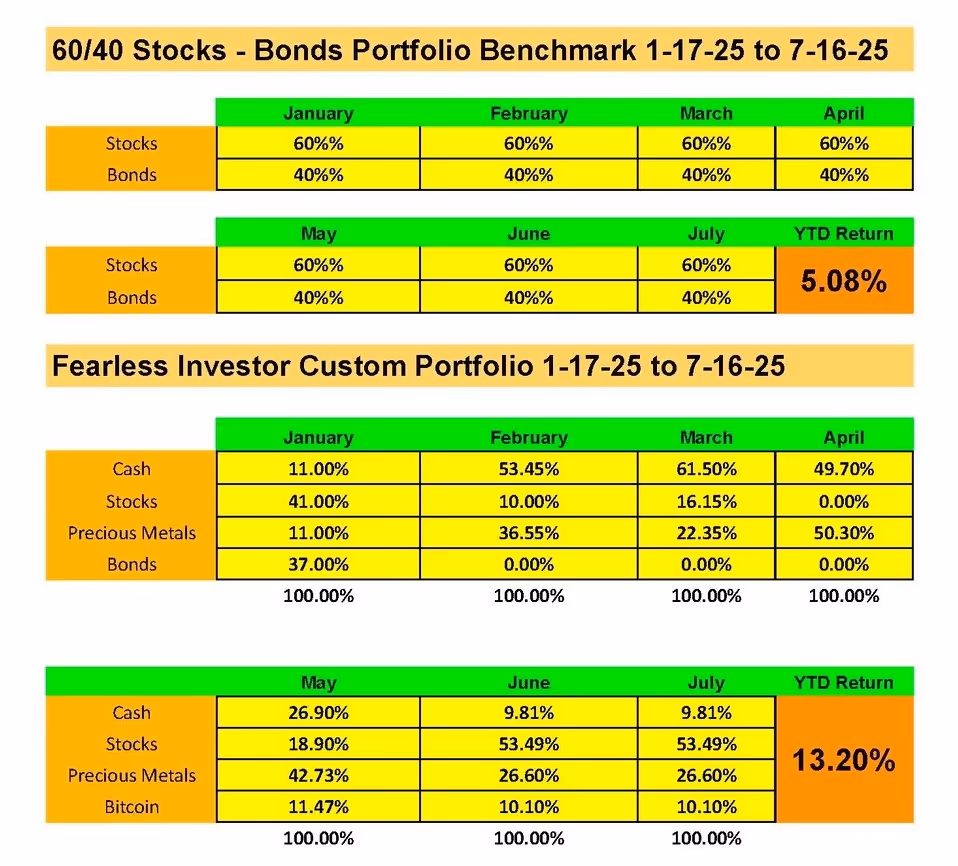
My Allocation Strategy YTD (And Why It Changed)
At the start of 2025, I was chasing performance and complexity:
50% in gold, silver, and mining stocks
25% in energy stocks
20% in commodities
5% in leveraged inverse ETFs tied to NASDAQ
The logic was to hedge event risk in stocks, play energy strength, and ride a possible breakout in precious metals.
Long-term Elliott Wave Principles drove the signals. It’s hard to follow, and detecting the wave formation is too hard for most investors.
Here’s what I learned:
Leveraged inverse ETFs are too volatile unless you actively trade them. I made money—but lost sleep.
Silver is more industrial than I accounted for. Tariffs, not just inflation, moved it.
Individual stocks are hard to own unless you understand the business deeply. I couldn’t keep up.
I don’t understand commodities, such as oil, gas, and agriculture. Uranium ought to be a good trade to piggyback nuclear, but so much is tied into long-term contracts that the spot price did not behave as I expected
So I rebalanced.
I changed frameworks to simplify.
The target allocation for the categories is:
S&P 500 - 60%
Precious Metals (replacing bonds) 30%
Bitcoin 10%
Those default percentages are based on historical performance and backtesting relative to a traditional 60/40 portfolio. The 40 bonds is replaced with precious metals and bitcoin.
The macro environment—encompassing growth, inflation, and deflation—determines whether it’s a risk-on or risk-off environment. If it’s risk-on, the allocation is 100% of the target; if it’s risk-off, the allocation is 50%.
There is a bottom-up adjustment based on volatility and momentum signals that can further adjust that allocation by 50% or down to zero.
If any of the categories is adjusted to zero, then the allocation for that category is moved into cash.
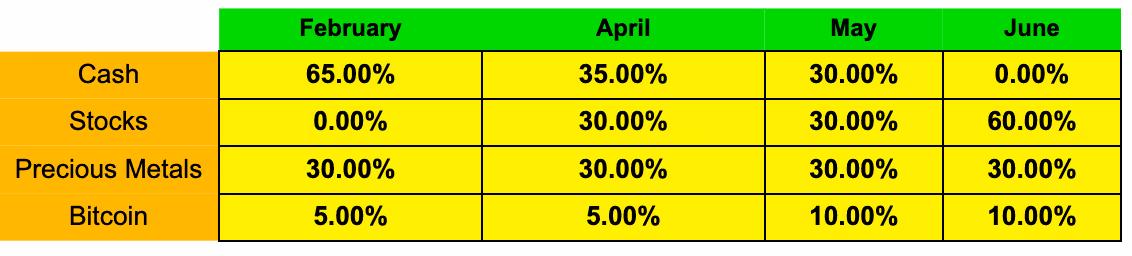
Now my allocation looks like this:
30% Gold & Miners (I still believe in monetary debasement risk)
60% S&P 500
10% Bitcoin
10% Cash/Short-term T-bills (for safety and liquidity)
(I know: that adds up to 110%, but I think of the cash in absolute terms, and the allocation is about investable assets.)
You can see how those categories have changed systematically year-to-date. (We discuss the system in more detail inside the community.)
I’ve simplified. I sleep better. And my decisions are now grounded in macro conviction, not “gut trades.”
People Love Their ‘Longs’ But You Shouldn’t Fall in Love
Let me be blunt: you are not your positions.
When you “fall in love” with a stock or sector, you stop being objective. You ignore new data. You defend it like it’s your child.
That’s how people held ARKK from $130 to $35. Or Tesla from $400 to $150. Or gold from $2,100 to $1,800.
One of the best skills you can develop as an investor is non-attachment.
Hold opinions loosely. Hold allocations with discipline. Fall in love with your system, not your stocks.
How Often Should You Rebalance?
Ah, the million-dollar question.
Some say monthly. Others say quarterly. Some wait for major macro events.
Here’s what I do:
I review my allocation weekly using a simple dashboard.
I rebalance when allocations drift by 5–10%, or when macro signals shift.
I log every trade and rate my emotional confidence in it (1–10).
I never act based on price alone. I act based on signals and process.
There’s no perfect frequency. But here’s the rule:
Want to move from reactive to intentional investing? Start here:
1. Write Your Allocation Rules
Create your own “Investor Operating Manual.”
Include:
Asset classes you want exposure to
Minimum and maximum % allocation for each
Your triggers for rebalancing
A “do not trade list” (mine includes levered ETFs!)
2. Track Portfolio Rotations
Once a month, answer this:
What’s rising?
What’s falling?
Why?
This helps you see patterns before they become consensus.
3. Talk to Smart People Who Disagree With You
Echo chambers feel nice.
But uncomfortable conversations lead to better decisions.
Join communities (like Fearless Investor) where your ideas get sharpened—not just validated.
Final Thought: Smart Isn’t Enough. Disciplined Is Better.
The biggest myth in investing is that intelligence leads to success.
It doesn’t.
Success belongs to those who:
Build a system.
Follow the data.
Control their emotions.
Rotate and allocate with purpose.
You don’t have to predict the future.
You just need to prepare for it better than the crowd.
📊 Want help building your portfolio strategy based on macro fundamentals?
Your Energy Partners
We help banks, family offices, HNWIs, non-profits-and developers in making strategic investments in clean energy projects that create tax credits to lower investors’ taxt liability while providing essential capital for developers.
For decades, the 60/40 portfolio (60% stocks, 40% bonds) was gospel.
The death of the “easy button” portfolio strategy
For decades, the 60/40 portfolio (60% stocks, 40% bonds) was gospel.
It promised:
Long-term growth from equities
Safety and income from bonds
Low volatility through diversification.
And it worked—in a world of falling interest rates, tame inflation, and central banks ready to cut rates at the first sign of stress.
That world is gone.
What Changed?
1. Bonds No Longer Hedge Stocks
Bonds used to protect you when stocks fell. Not anymore.
In 2022, both asset classes dropped—marking the worst year for 60/40 portfolios since 1937.
📉 The S&P 500 fell 19%
📉 The Bloomberg U.S. Aggregate Bond Index fell 13%
Pre-2000, the stock-bond correlation was 78% positive and bonds did not hedge stocks reliably.
2000-2020, a period of low interest rates and low inflation, saw reliable stock-bond negative correlation—the hedge worked well.
Since 2020, the correlation switched.
Why? Because rising inflation hurts both stocks and bonds. Your portfolio wasn’t diversified—it was doubly exposed.
2. Yields Are Back, But So Is Risk
Today, bond yields are above 5%. That sounds attractive… until you realize:
They’re competing with inflation
Duration risk is massive when the Fed is data-dependent
Government debt is exploding
And if rates stay elevated? Bond prices suffer.
If rates drop because of recession? Stocks will tank.
You’re cornered either way.
3. Market Concentration = Fragility
60% stocks means 60% exposure to… what, exactly?
Seven stocks (Apple, Nvidia, Microsoft, Amazon, Google, Meta, Tesla) now make up over 30% of the S&P 500. You’re not buying the “market.” You’re buying tech, leverage, and hype.
Diversified? Not really.
What I Do Instead: The 30/30/30/10 Portfolio
To adapt, I’ve restructured how I allocate capital to four categories:
Cash-Short-term fixed income Wait and see while earning a decent return—T-Bill and chill
Stocks Trend following, S&P 500 mostly, because my approach is top-down macro rather than bottom-up fundamental.
Precious Metals Primarily gold with a smaller allocation to silver and to miners. This is a strategy designed to reflect themes of a declining USD, structural shifts in geopolitics and the ongoing monetary debasement pursued by most central banks.
Crypto All Bitcoin, because I don’t understand/follow any other crypto. This asset class is maturing, with increasing institutional participation and has some of the same themes as precious metals.
This allocation shifts based on a number of factors (see below):
The macro regime
Volatility
Momentum
The allocation ought not to move a lot—maybe once or twice a month. The simplicity of having only four categories makes it easy to follow.
This mix isn’t perfect—but it’s adaptable. It lets me pivot based on what actually moves markets: energy, policy, inflation, geopolitics, volatility and momentum.
The Takeaway
60/40 was the autopilot portfolio for a world that no longer exists.
If you’re still using it, you’re not diversified. You’re exposed.
Now is the time to think deeply about your portfolio.
What assumptions are baked into it?
What risks are you not seeing?
What’s your real exposure to inflation, policy, and volatility?
📞 Want to build a future-proof portfolio?
If you’re serious about repositioning capital into high-conviction, real-world sectors like energy,
👉 Book a call with Dakota Ridge Capital
Your Energy Partners
We help banks, family offices, HNWIs, non-profits-and developers in making strategic investments in clean energy projects that create tax credits to lower investors’ taxt liability while providing essential capital for developers.
Unlock the Opportunities of the Inflation Reduction Act! Are you ready to stay ahead in today's shifting economic landscape? Our comprehensive white paper breaks down the Inflation Reduction Act and reveals the key benefits, incentives, and strategies your business needs to capitalize on. Learn how to optimize your financial planning, leverage tax credits, and position your company for sustainable growth.
Pre-order now to get the insights and actionable steps that can give your business a competitive edge.
New Version Release Date: 12/10/2024
Thank you! Your submission has been received!
Oops! Something went wrong while submitting the form.
.svg)
.svg)
.svg)

.avif)
.svg)
.svg)


.webp)